By Rebekah Miracle (AERA GIS specialist)
As the geographic information specialist (GIS) at AERA, my job is to digitally archive, synthesize and present our excavation data in ways that make it more understandable and usable to other people – both to our own researchers and, through articles and illustrations, to other people who may have never seen our sites before. Working with the Mit Rahina site data from Memphis is a bit different than working with our Giza data. While I know the Giza sites backwards and forwards, I’ve never seen the Mit Rahina site in person.
In some ways this makes my job harder, as I have to orient myself solely through our excavation archive. In other ways though, this helps me to do my job better, as I can’t take anything for granted and I know that if something doesn’t make sense to me, it probably won’t make sense to outside researchers either. I feel like I am the canary in the coal mine for data clarity this year!
Though I am working from my home in Austin, Texas, we have twice-weekly team meetings and constantly send documents back and forth. Despite the 7100 miles between my home and the site, it actually works very smoothly. The only problem is trying to schedule meetings when there is an eight hour time difference and the team members are on three different continents!
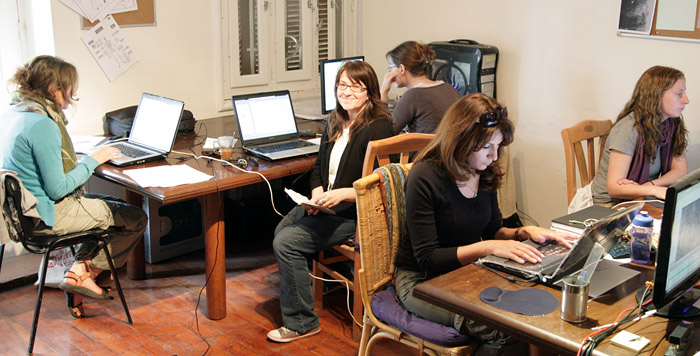
A very international team crowds into the ‘Charles and Lisa Simonyi Synergy Center’ (a.k.a. the GIS Lab) at Giza in 2011. Left to right: Kasia Olchowska (Poland), Rebekah Miracle (USA), Delphine Driaux (France), Nagwan Elhadedi (Egypt) and Brittany Hughes (USA). Photo by Hilary McDonald.
During the 2011 excavation the Egyptian and foreign team digitized some of the built architecture – walls, thresholds, silos — but with the pace of excavation and recording there was still much left to do. This year I started working with the Mit Rahina site data before the season officially began and I’ve already finished digitizing everything else into our geographic information system (GIS) — this includes deposits, cuts, fills, space limits, sondages and finds locations. Now I have started making phase maps that illustrate how the site functioned over various time periods.
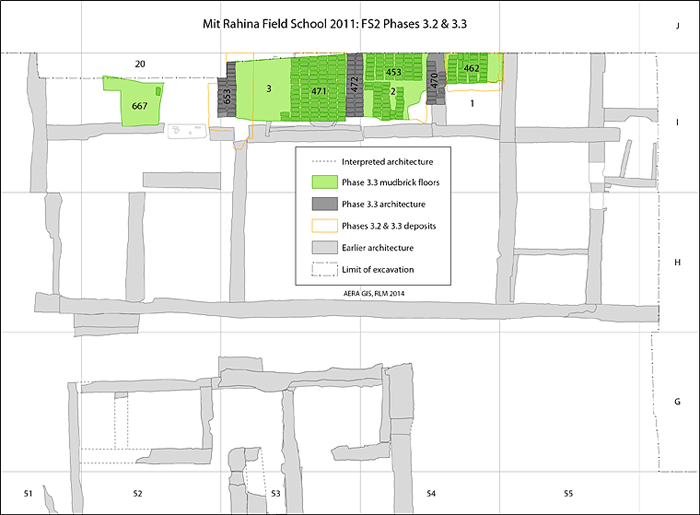
A preliminary map showing the site during a later phase of its building, when mudbrick floors were added in the northern part of the site. MRFS – GIS, Rebekah Miracle.
Soon I will start working with the specialists’ data to show the distribution of finds like ceramics, sealings and objects throughout our site.
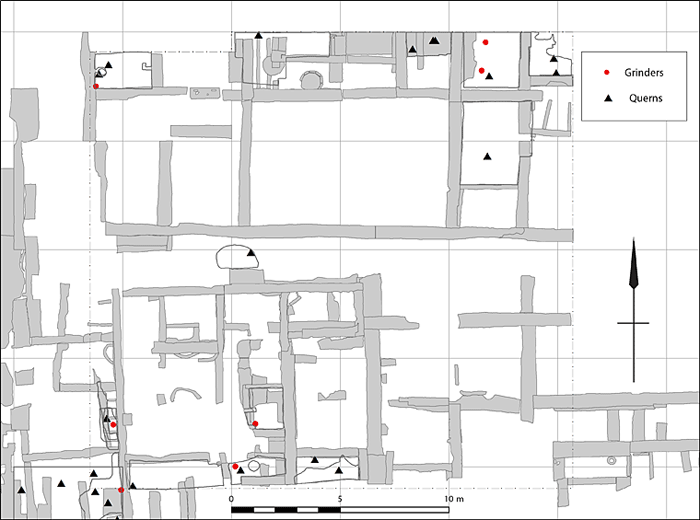
A preliminary map showing the find locations of querns and grinders on the MRFS site. MRFS-GIS, Rebekah Miracle.
Hopefully, all of the maps I make this season will help us to make better sense of the data and to illustrate to other people around the world what we have found at the Mit Rahina site.